Plotting
If you have matplotlib installed, the scan.plot function will automatically be available, subfunctions of scan.plot include the ability to automatically generate various plots.
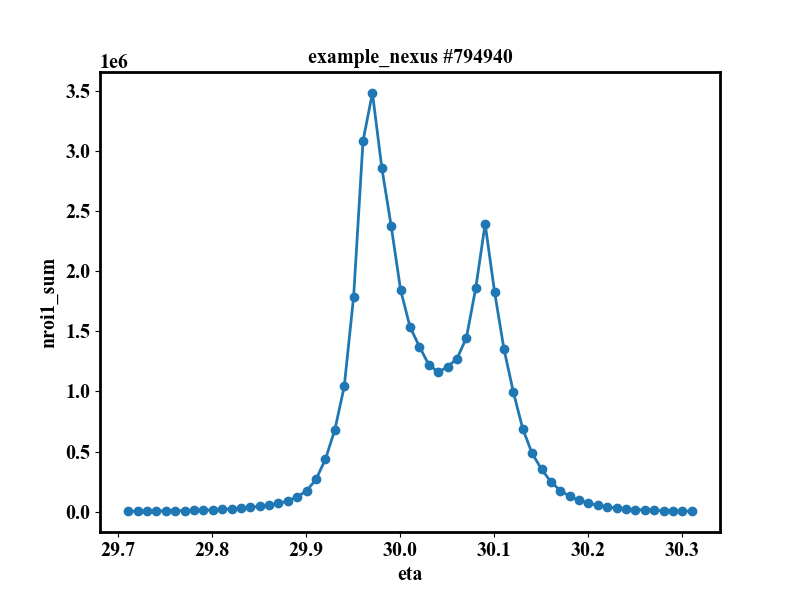
Even without matplotlib, it is still possible to generate data for plotting easily using scan.get_plot_data:
import babelscan
scan = babelscan.file_loader('12345.nxs')
x, y, dy, xlab, ylab = scan.get_plot_data('axes', 'nroi_peak[31,31]', signal_op='/count_time/Transmission', error_op='np.sqrt(x+1)')

# equivalent to scan.plot()
plt.figure()
plt.errorbar(x, y, dy, fmt='-o')
plt.xlabel(xlab)
plt.ylabel(ylab)
plt.title(scan.title())
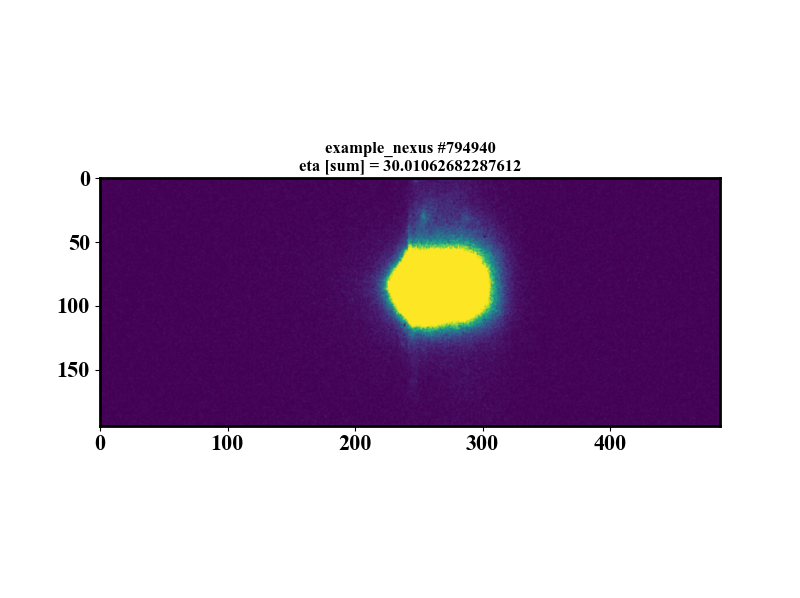
You can also easily plot detector images from scan objects:
import babelscan
scan = babelscan.file_loader('12345.nxs')

scan.plot.image(index='sum')
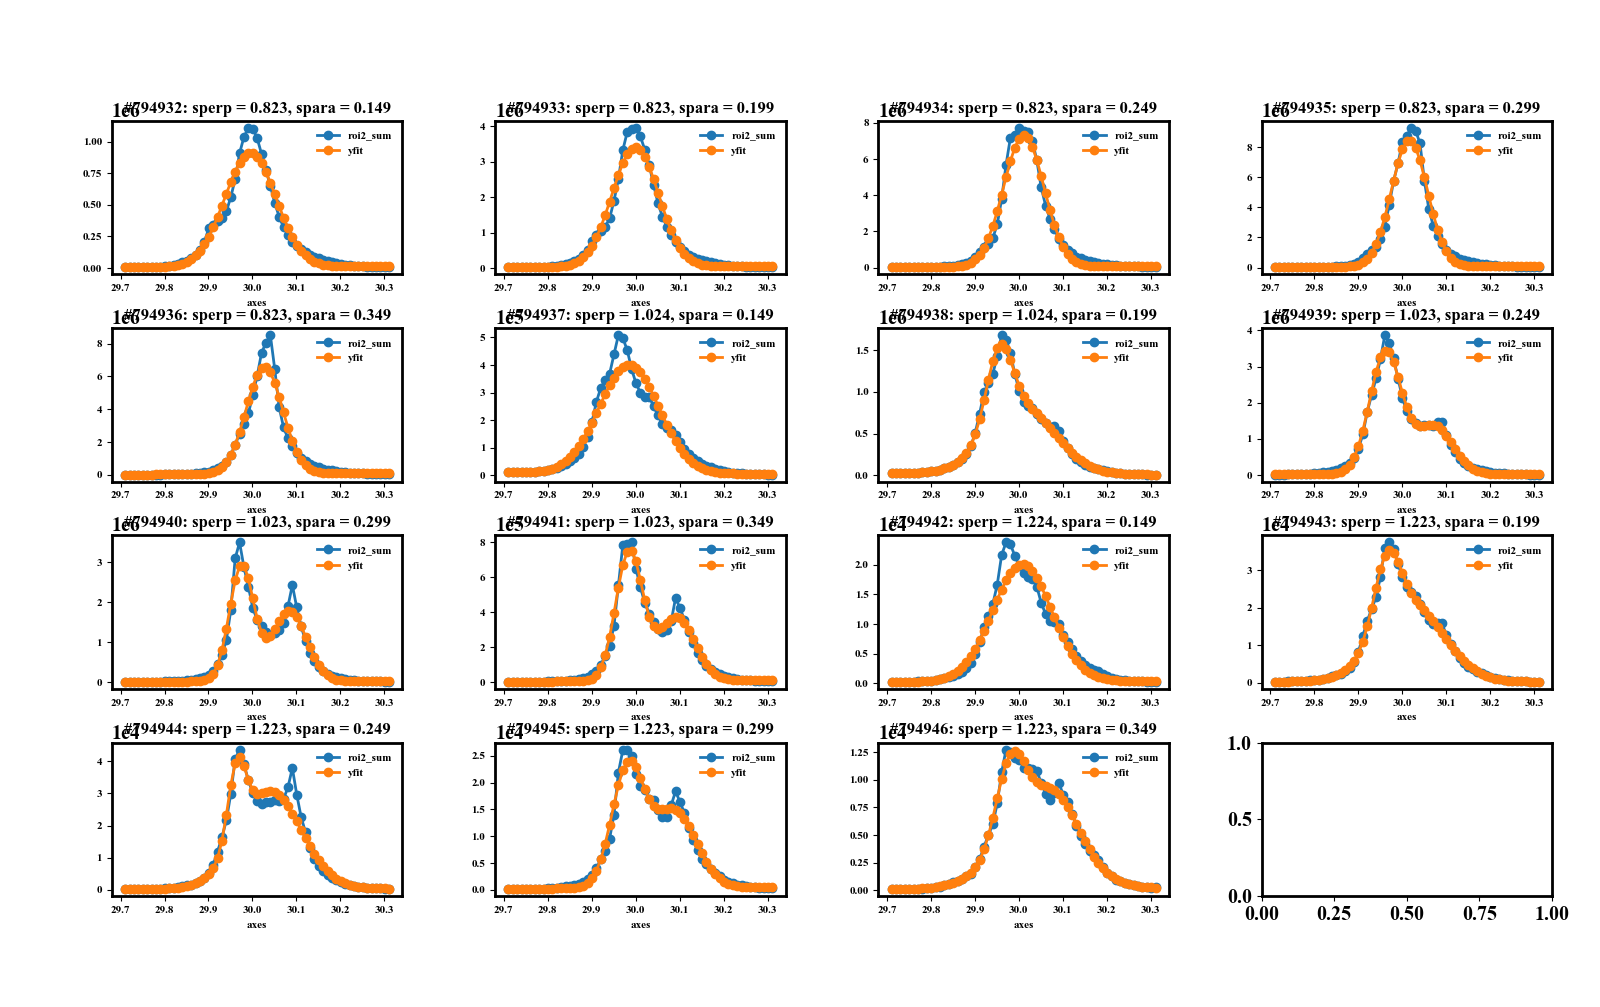
Plus, if you create a multiscan object, you can make use of automated plotting arguments here too:
import babelscan
exp = babelscan.FolderMonitor("/some/folder)
scans = exp.scans(range(794932, 794947, 1), ['sperp', 'spara'])

scans.fit.multi_peak_fit(peak_distance_idx=5, print_result=True, plot_result=True)
scans.plot.plot_simple('sperp', 'amplitude')
scans.plot.multiplot(yaxis=['signal', 'yfit'])